1Overview
Modern engineering systems increasingly rely on sensor networks and data analytics to monitor performance, detect anomalies, and inform critical decisions. The integration of sensing technologies with data processing methods has changed how engineers assess system health across applications. Across disciplines, the pattern is the same. In mechanical engineering, vibration and acoustic-emission data enable condition monitoring and fault diagnosis of rotating machinery. In biomedical engineering, medical imaging and physiological monitoring (ECG, EEG, PPG, wearables) support screening, diagnosis, and longitudinal care. Transportation engineering integrates fixed detectors with probe data from smartphones and connected vehicles for traffic state estimation, incident detection, and adaptive signal control. Water resources engineering relies on SCADA telemetry (pressure, flow, level, and water-quality indicators) to ensure reliable supply and early anomaly alerts.
While sensing techniques and data analytics have broad applications across engineering disciplines, this course focuses specifically on structural health monitoring of bridges. The principles of sensor selection, signal processing, feature extraction, and decision-making covered here carry over to other fields, so students can adapt these concepts to their own area. Whether monitoring industrial equipment, analyzing biomedical signals, or assessing infrastructure systems, the core methodology of turning raw sensor data into engineering decisions stays the same.
2Structural Health Monitoring
Imagine driving across a bridge and feeling the structure respond to traffic loads around you. While most people trust that the concrete and steel beneath them is safe, what if that bridge could communicate its actual condition? What if it could alert engineers when components are deteriorating or when maintenance is urgently needed? Just as physicians use diagnostic tools (stethoscopes, blood tests, imaging) to detect health issues before they become critical, structural health monitoring (SHM) employs sensors and analytics to continuously evaluate infrastructure condition [1, 2].

Figure 1:Analogy between medical health monitoring and structural health monitoring.
SHM combines two essential capabilities: continuous sensing of structural response and data analytics to interpret that data. The sensing infrastructure captures how structures behave under real-world conditions, while analytics translate those measurements into actionable insights about structural health.
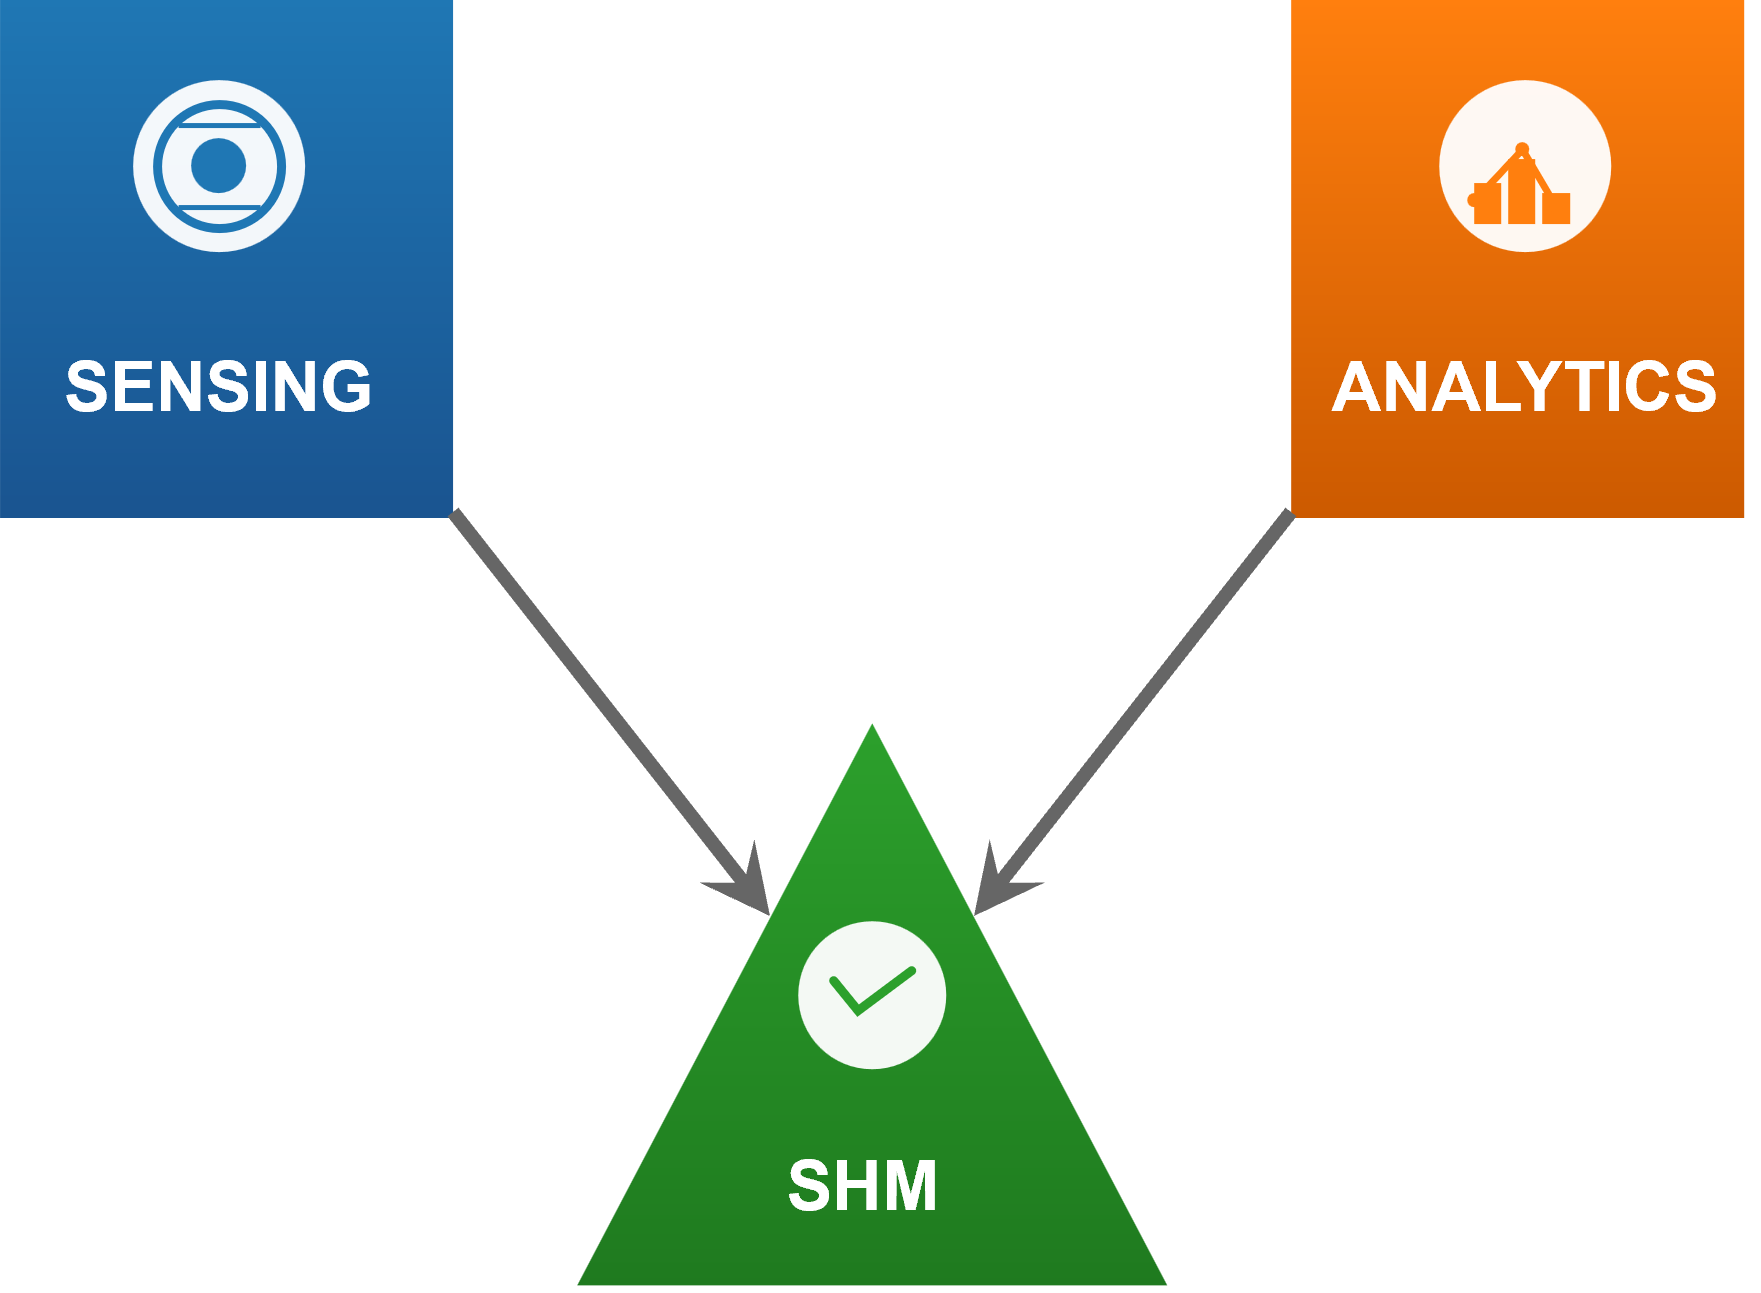
Figure 2:Course pillars. Sensing gathers observations, data analytics extracts meaning, and SHM operationalizes both for decisions.
SHM represents a systematic approach to understanding four critical aspects of structural performance:
Loading Conditions: Measuring the actual forces and environmental conditions that affect the structure during service, including traffic loads, wind, temperature variations, and seismic activity.
Damage Identification: Detecting mechanical deterioration that results from operational loading and environmental exposure, often before damage becomes visible through conventional inspection methods.
Damage Progression: Tracking how structural damage evolves over time, enabling engineers to understand deterioration rates and predict future condition.
Performance Forecasting: Predicting remaining service life and future performance as damage accumulates, supporting informed decisions about maintenance timing and scope.
This monitoring approach shifts infrastructure management from reactive maintenance, which addresses problems only after they appear, toward predictive strategies that catch issues before they compromise safety or serviceability. Through continuous data collection and analysis, SHM gives engineers detailed insight into structural behavior that periodic inspection cannot provide [2, 3].
3What is Sensing?
In the context of civil infrastructure (especially bridges), sensing refers to the use of devices (sensors) to detect and measure physical properties of a structure and convert those measurements into data. A sensor is essentially a transducer, a device that transforms a physical quantity (like strain or acceleration) into a signal (often electrical) that can be read and analyzed. By deploying sensors on a bridge, engineers can capture the bridge’s response to loads and environment in real time, creating a digital stream of information about its condition. This continuous data collection is the cornerstone of modern bridge monitoring, enabling insights that go far beyond what periodic visual inspections can provide.
3.1What Do Sensors Measure?
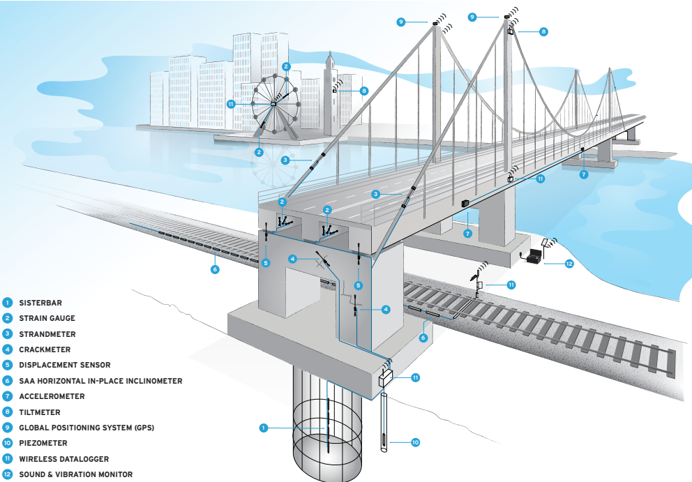
Bridges experience a range of physical effects under traffic, wind, and temperature change. A variety of sensor technologies capture these different aspects of structural behavior. Some common examples include:
Accelerometers: Measure acceleration of the structure (vibrations). Widely used for detecting dynamic responses and identifying modal properties (natural frequencies, mode shapes). For instance, accelerometers on a bridge can record how the bridge vibrates under traffic or wind; changes in those vibration characteristics can indicate stiffness loss or damage.
Strain Gauges: Measure strain (deformation) at a point on a structural member. They can be used to infer stress levels and track how loads are distributed through the structure. If a critical girder develops a crack, nearby strain gauges might show abnormal strain patterns under load.
Displacement or Tilt Sensors (Inclinometers): Track movements or rotations. These help monitor deflections of spans, settlement of supports, or excessive tilting, all of which could signal structural issues.
Fiber Optic Sensors: Including Fiber Bragg Gratings (FBG) and distributed sensing (e.g. Brillouin scattering-based), these can measure strain or temperature over long distances of fiber. They are useful for continuous strain monitoring along a bridge girder or cable, and are immune to electromagnetic interference.
Acoustic Emission Sensors: Listen for the high-frequency “pings” of cracks growing or wires breaking. In prestressed concrete or metal bridges, acoustic sensors can sometimes catch the sound of a crack propagating in real time.
Environmental Sensors: Thermometers, anemometers (wind speed), humidity sensors, etc., are often included to correlate structural behavior with environmental conditions. For example, bridge expansion joints might show movement corresponding to temperature changes.
Each sensor produces a time-series of data, a signal that varies over time and captures one specific aspect of the structure’s performance. Together, these signals provide a full picture of the bridge’s state. Figure 3 helps you reason about what to measure and where to place sensors for maximum information.
3.2Sensors as Transducers
It is important to note that sensors do not create the phenomena they measure; they respond to them. Most sensors in civil infrastructure work by converting a physical change into an electrical signal. For instance, a strain gauge changes its electrical resistance when stretched, a piezoelectric accelerometer produces a voltage when it experiences acceleration, and a fiber-optic sensor modulates light signals in response to strain or temperature. In all cases, the sensor output (voltage, current, light intensity, etc.) must be interpreted as a measurement of the underlying physical quantity. This transduction principle is what allows bridge vibrations or material strains to be turned into digital data that engineers can analyze. Without transducers, the subtle changes occurring inside a large structure would remain invisible to us.
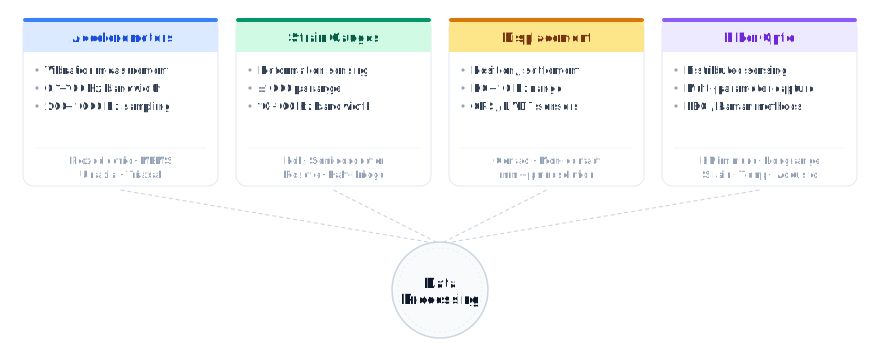
Figure 4:Sensor Types Overview
3.3Categories of Sensing Technologies
There are many ways to categorize sensors used in SHM, but three fundamental distinctions are especially relevant to bridge monitoring:
Analog vs. Digital Sensors: An analog sensor produces a continuous signal (often a voltage) proportional to the measured quantity, whereas a digital sensor provides data in a digital format (discrete values or communication protocols) that can be directly used by computers. In practice, analog sensors (like traditional strain gauges or analog accelerometers) require an analog-to-digital converter to record their output, while digital sensors (such as smart sensors with built-in microcontrollers) output measurement data as digital packets. The choice affects the data acquisition design: analog sensors are simple and often have high fidelity, but can be susceptible to noise over long cable lengths; digital sensors integrate the conversion electronics to transmit data with less noise interference. Both types are widely used in bridge SHM. For example, a bridge monitoring system might use analog strain gauges wired to a central logger, alongside digital sensors like a GPS receiver that directly outputs displacement readings. The trend in modern SHM is toward more digitization at the sensor level (so-called “smart sensors”), which simplifies data transmission and enables on-sensor processing [5].
Passive vs. Active Sensors: A passive sensor simply observes the structure’s natural response or ambient conditions without emitting any energy of its own. Examples include passive thermocouples (which generate a voltage from temperature differences) or accelerometers that record ambient vibrations. In contrast, an active sensor emits a known input or excitation into the structure and measures the structural reaction to that input. Active sensors essentially act as both a sensor and an actuator. For instance, in some bridge monitoring applications, an active acoustic sensor might send an ultrasonic pulse through a bridge girder and record the echo to detect cracks (similar to medical ultrasound). Most traditional SHM of bridges relies on passive sensing (listening to how the bridge naturally vibrates under traffic or wind), but active sensing is used in special cases (e.g., impact echo tests or guided wave ultrasonic methods for crack detection). In the broader SHM context, a passive SHM approach means using only passive sensors to detect events like ambient vibration or acoustic emissions from cracks. An active SHM approach uses actuating transducers to probe the structure; for example, an array of piezoelectric patches can both send and receive stress waves, and any changes in the received signals indicate damage. Both approaches are valuable, and hybrid systems (which can passively listen most of the time but occasionally inject test signals actively) are increasingly common in research.
Wired vs. Wireless Sensors: The method of data transmission represents another critical design consideration in bridge monitoring systems. Wired sensors establish physical connections through cables for both power supply and data communication, offering highly reliable data transmission with minimal latency and no concerns about radio frequency interference or battery life. Traditional wired systems typically employ centralized data acquisition architectures where all sensors connect to a main data logger or acquisition unit. This approach provides excellent data integrity and synchronization across all measurement channels, making it particularly suitable for high-frequency monitoring applications such as dynamic testing and modal analysis. However, wired installations can be complex and costly, especially for large bridges where cable routing may require extensive conduit systems or specialized cable management solutions. Wireless sensors, by contrast, transmit data via radio frequencies and are typically battery-powered or energy-harvesting units that communicate with base stations or gateway devices. Modern wireless sensor networks offer significant advantages in terms of installation flexibility and reduced infrastructure requirements. Each wireless sensor node can incorporate local processing capabilities, enabling edge computing features such as data compression, preliminary analysis, and intelligent triggering based on local conditions. This distributed architecture provides inherent redundancy: if one communication path fails, alternative routing through neighboring nodes can maintain data flow. Wireless systems excel in retrofit applications where cable installation would be prohibitively expensive or logistically challenging. However, they require careful consideration of power management, communication reliability, and data synchronization across the network. Advanced wireless protocols like IEEE 802.15.4 and LoRaWAN have been specifically developed for industrial monitoring applications, offering extended range and low power consumption suitable for long-term structural monitoring deployments.
Ultimately, the sensing infrastructure of a bridge is its nervous system. By selecting appropriate sensor types and deployment methods (wired or wireless, analog or digital, passive or active), engineers instrument the bridge so that it can “feel” and report on stresses and damage. The raw data from these sensors is the first pillar of structural health monitoring. Making sense of that data requires the second pillar: data analytics.
4Data Analytics
4.1From Data to Insights
Raw sensor data by itself is of limited use; it must be processed and interpreted to reveal the condition of the structure. Data analytics in SHM refers to the collection of techniques used to cleanse the data, extract meaningful information (features), and infer the health of the structure from those features. Bridge monitoring produces vast amounts of time-series data (for example, vibration records or strain readings over months and years). The role of data analytics is to turn this flood of numbers into actionable knowledge about the bridge’s integrity. This involves distinguishing true structural signals from noise, combining data from many sensors, and detecting patterns or changes that signify damage. In essence, if sensors are the eyes and ears of an SHM system, data analytics is the brain, interpreting sensor inputs to make decisions about structural safety.
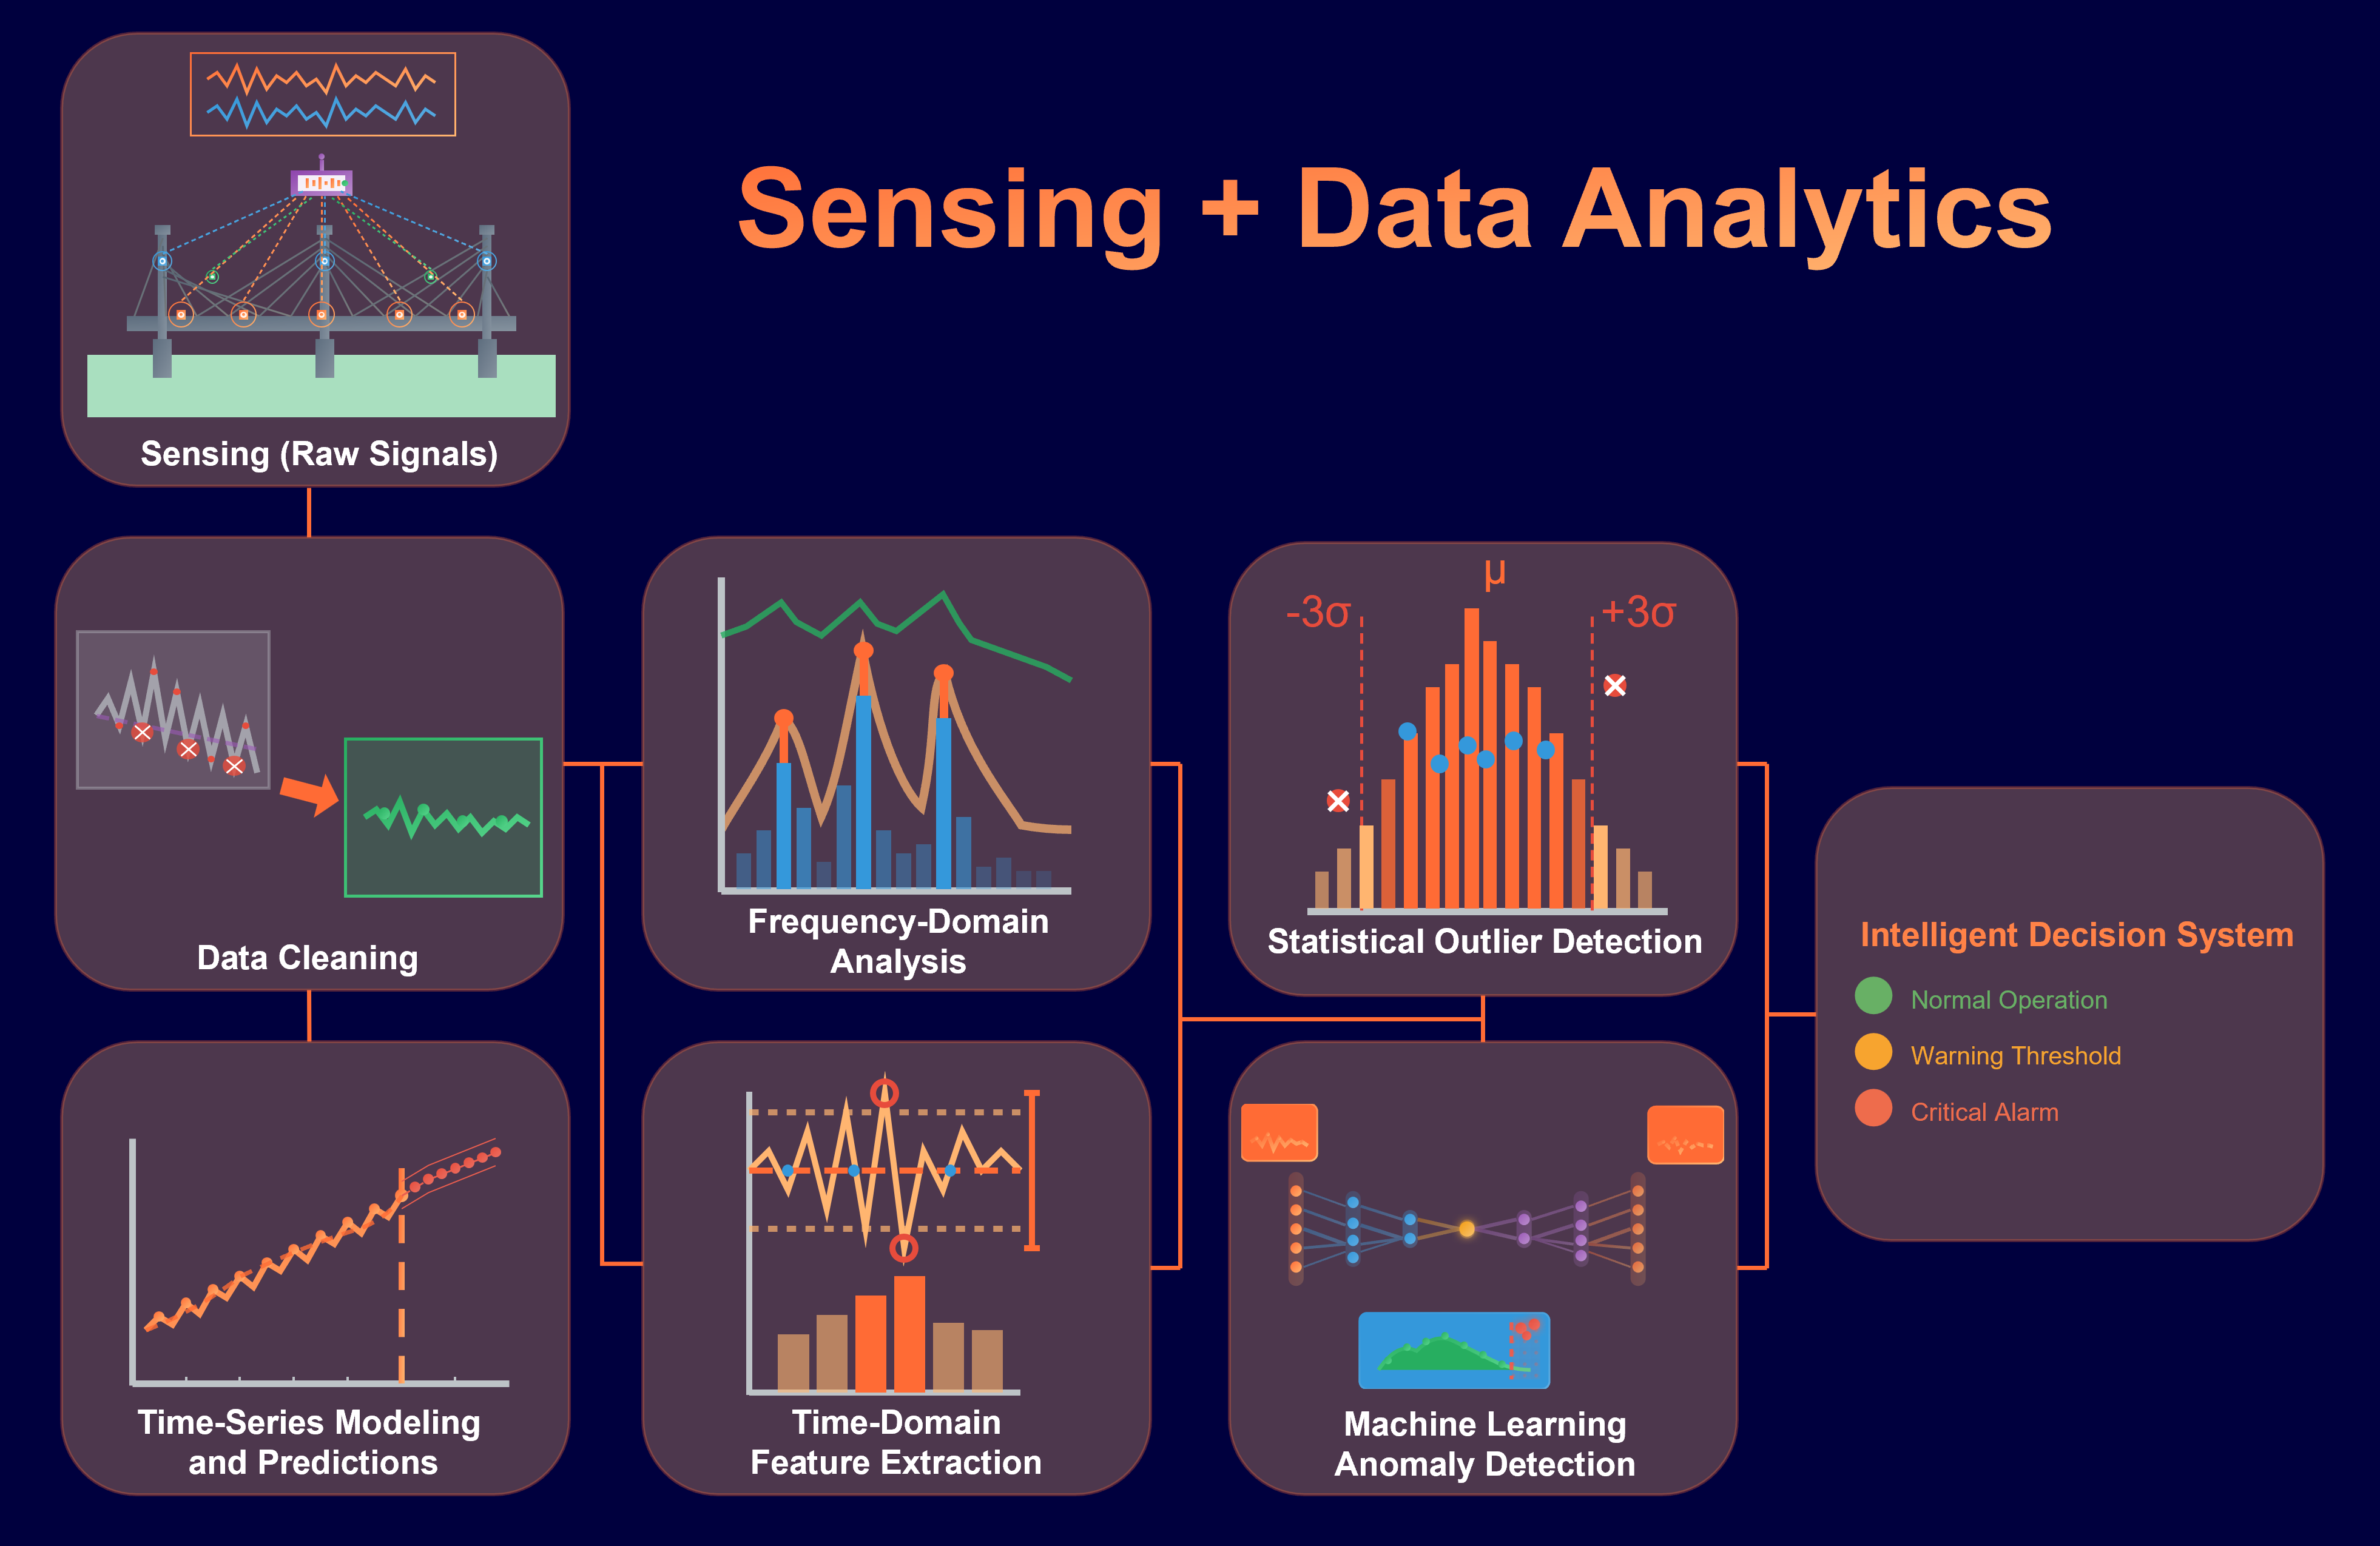
Figure 5:Conceptual flow of sensing and data analytics in an SHM system.
4.2Challenges in Sensor Data
Real-world data is messy. One major task in SHM analytics is data preprocessing, which includes cleaning and denoising the sensor signals. Structural signals are often buried in various sources of noise: electrical noise from instrumentation, environmental influences (temperature shifts can drift strain readings, wind or traffic may mask subtle vibration modes), and other operational variability. For example, a strain gauge might slowly drift due to temperature changes, or an accelerometer signal might include high-frequency noise from electrical interference. These unwanted components must be filtered out or compensated for. Digital signal processing techniques, such as filtering, averaging, or baseline correction, are applied to remove these “unwanted effects” so that the true structural response can be isolated. Another challenge is dealing with environmental and operational variations: a bridge’s vibration characteristics can change with temperature, humidity, or vehicle loads in ways that resemble damage. Effective SHM analytics must account for these variations (for instance, by normalization or statistical compensation) to avoid false alarms. Data may also have gaps or outliers (spurious spikes, dropped readings) that need to be handled. Cleaning and organizing the sensor data is thus a critical first step before any higher-level analysis.
Signal vs. Noise: A key concept in SHM data analytics is improving the signal-to-noise ratio. The “signal” is the meaningful response of the structure (for example, the vibration pattern of a bridge span), while “noise” is anything obscuring that signal (random fluctuations, sensor errors, environmental effects). Techniques like averaging multiple measurements, using noise filters, or subtracting baseline trends help enhance the signal relative to noise. In a long-term monitoring system, one might build a baseline model of the structure’s normal behavior under varying temperature and loading; then new data can be compared to this baseline to pick out abnormal deviations. This way, natural variability (noise in the context of damage detection) is separated from true structural changes (the signal of damage). Managing the signal vs. noise issue is fundamental: it ensures that when the data analytics flags a change, it is truly due to a structural issue and not just random fluctuation or a hot afternoon.
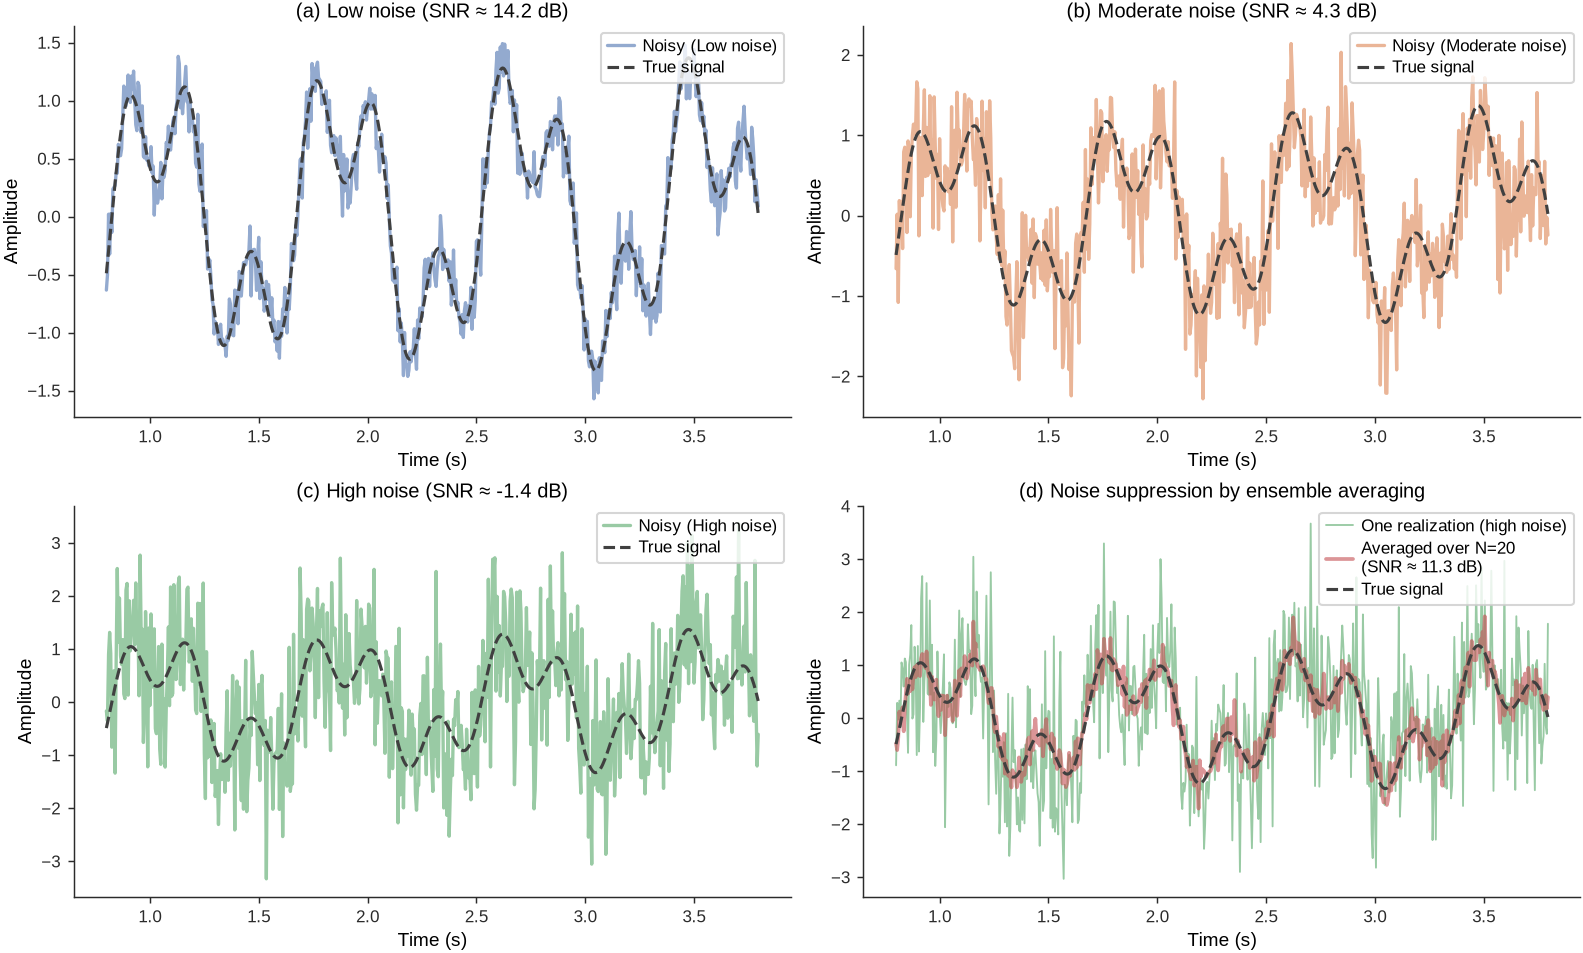
Feature Extraction and Transformation: Once the data is cleaned and stabilized, the next step is to extract features that are sensitive to structural condition. Raw time-series data (e.g., an acceleration trace over time) is often high-dimensional and not directly interpretable regarding damage. Feature extraction means distilling the raw data into informative metrics or descriptors. This can involve mathematical transformations. A classic example is transforming a time-domain signal into the frequency domain using the Fast Fourier Transform (FFT) to identify dominant frequencies or mode shapes of a bridge. Bridges have natural vibration frequencies; if a bridge is damaged (say a crack develops), its stiffness changes and thus its natural frequencies might shift. By looking at the spectrum of vibration (peaks in the frequency domain), one can detect such shifts. Thus, frequency-domain features (natural frequency values, amplitude of certain mode shapes, etc.) are very useful. Other feature extraction techniques include calculating statistical measures (means, standard deviations, peak values of strain over a day), identifying time-domain patterns (e.g., the peak acceleration during each truck passage), or more advanced methods like wavelet transforms for capturing transient events. The goal is to reduce data volume while amplifying the aspects of the signal that relate to structural health. Instead of keeping every data point from an accelerometer, an SHM system might periodically record just a few features: the first several natural frequencies, the damping ratio, and perhaps some mode shape metrics. These features are far more tractable for analysis and tend to remain relatively stable unless the structure’s condition changes. More recently, feature extraction can be done with automated learning methods, for instance using principal component analysis or autoencoder neural networks to learn the key characteristics of the data. Whether manual or automated, feature extraction is a bridge between raw data and decision-making: it provides damage-sensitive features that condense the information.
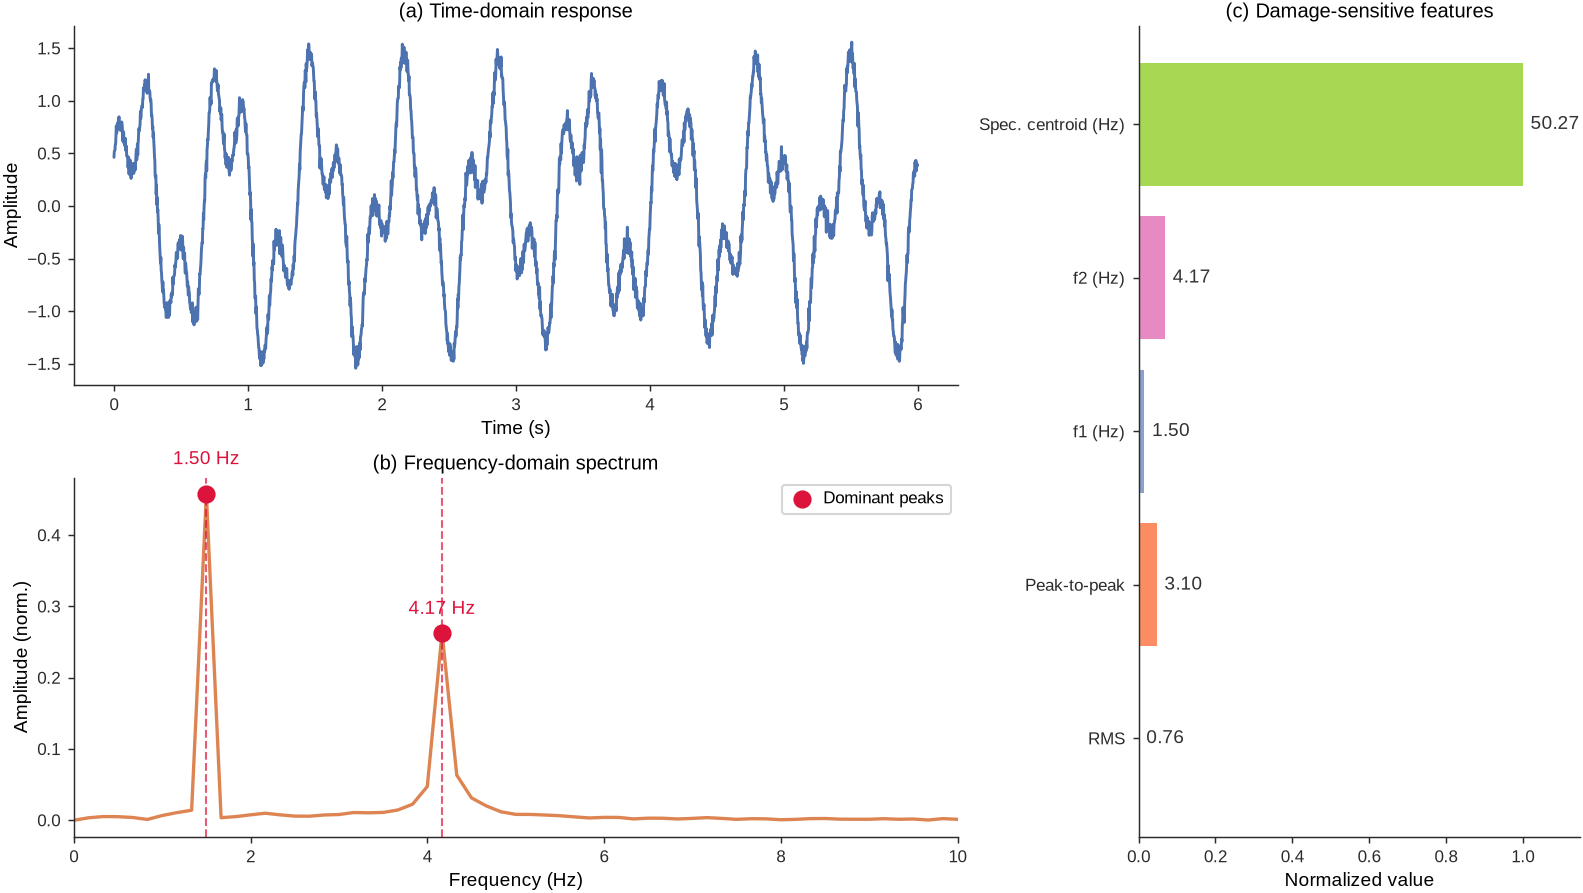
Figure 7:Feature extraction and transformation: time-domain response, frequency-domain spectrum with dominant modes, and a normalized feature vector.
Time vs. Frequency Domain: Time-domain and frequency-domain analysis give complementary views of the same data in SHM. Time-domain analysis deals with signals as a function of time, for example plotting strain vs. time to look for sudden jumps when a crack forms, or analyzing the autocorrelation of a vibration signal. Frequency-domain analysis looks at the signal’s composition in terms of frequencies, for instance using spectra or modal analysis to identify the structure’s vibrational modes. Both perspectives are valuable. Some damage signatures are more easily observed in the time domain (a transient impact or an abrupt change in strain), while others manifest in the frequency domain (a gradual shift in natural frequency, or the appearance of a new low-frequency mode due to a loss of stiffness). Therefore, SHM data analytics employs both: time-domain signal processing techniques (covered in Chapter 3) and spectral analysis techniques (covered in Chapter 4) are complementary tools. For example, one common approach is to continuously record a bridge’s acceleration (time domain), then periodically compute its frequency spectrum to track any changes in modal frequencies over months or years. Any significant deviation beyond normal fluctuations could indicate damage or degradation. In short, time-domain data is the raw narrative of what happens to the structure, while frequency-domain data often provides a clearer “summary” of structural properties; SHM analysts use both views to get a complete picture.
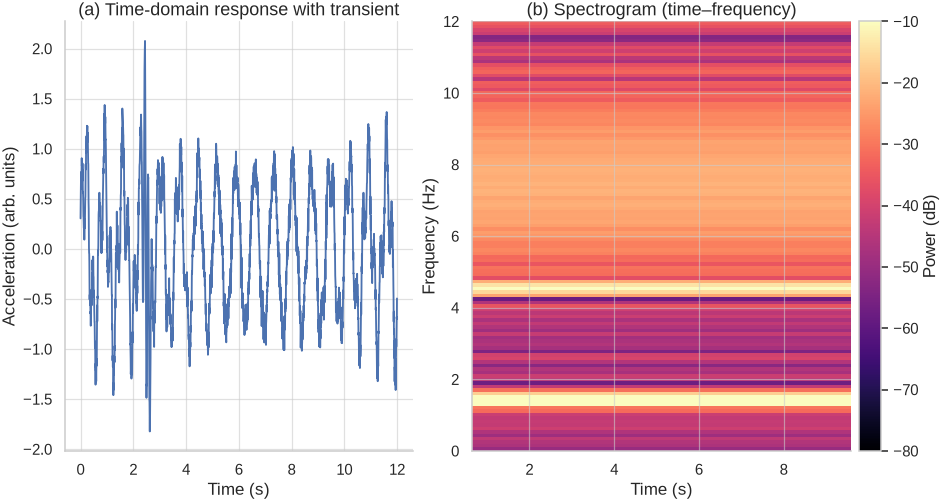
Figure 8:Time vs. frequency domain: a vibration signal with transient excitation (left) and its time-frequency representation via spectrogram (right), revealing modal content and evolution.
Statistical and Machine Learning Models: After feature extraction, we need to interpret the features to assess structural health. This is where statistical analysis and machine learning (ML) come into play. In many SHM implementations, a statistical pattern recognition approach is used [1]. The idea is to establish a baseline distribution of feature values for the healthy structure and then detect statistically significant deviations from that baseline. This could be as simple as control charts (flag if a feature exceeds normal bounds) or as sophisticated as multivariate outlier detection in a high-dimensional feature space. Because environmental factors can influence features, often a damage detection algorithm will use statistical models (like regression or cointegration) to first normalize features with respect to temperature or other factors, and then apply a damage index threshold. Machine learning extends this idea by potentially learning more complex patterns. Supervised learning can be used if historical data with known damage states exists: for example, a classifier could be trained on features to distinguish “intact” vs “damaged” conditions (though in practice, labeled damage data on real bridges is scarce). Unsupervised learning is common in SHM: methods like clustering or novelty detection (one-class SVMs, autoencoders, etc.) can learn the pattern of normal data and then detect when new data doesn’t fit that pattern, a sign of possible damage. More advanced ML models, including neural networks, have been explored to predict damage location or severity from features, effectively learning the inverse mapping from measured data to damage characteristics. Regardless of the specific technique, the role of data analytics models is to classify or predict the structural condition using the processed sensor data. For example, a machine learning model might analyze the vibration signature of a bridge and output a likelihood of damage being present, or even estimate what type of damage and where. Importantly, these models must be robust to noise and environmental variation, as mentioned, and ideally provide confidence measures to help engineers make decisions. Data analytics thus transforms the features into a diagnosis or prognosis, for instance detecting that “the bridge’s first natural frequency has dropped by 5% from baseline, which statistically indicates a loss of stiffness in one of the girders with 95% confidence.”
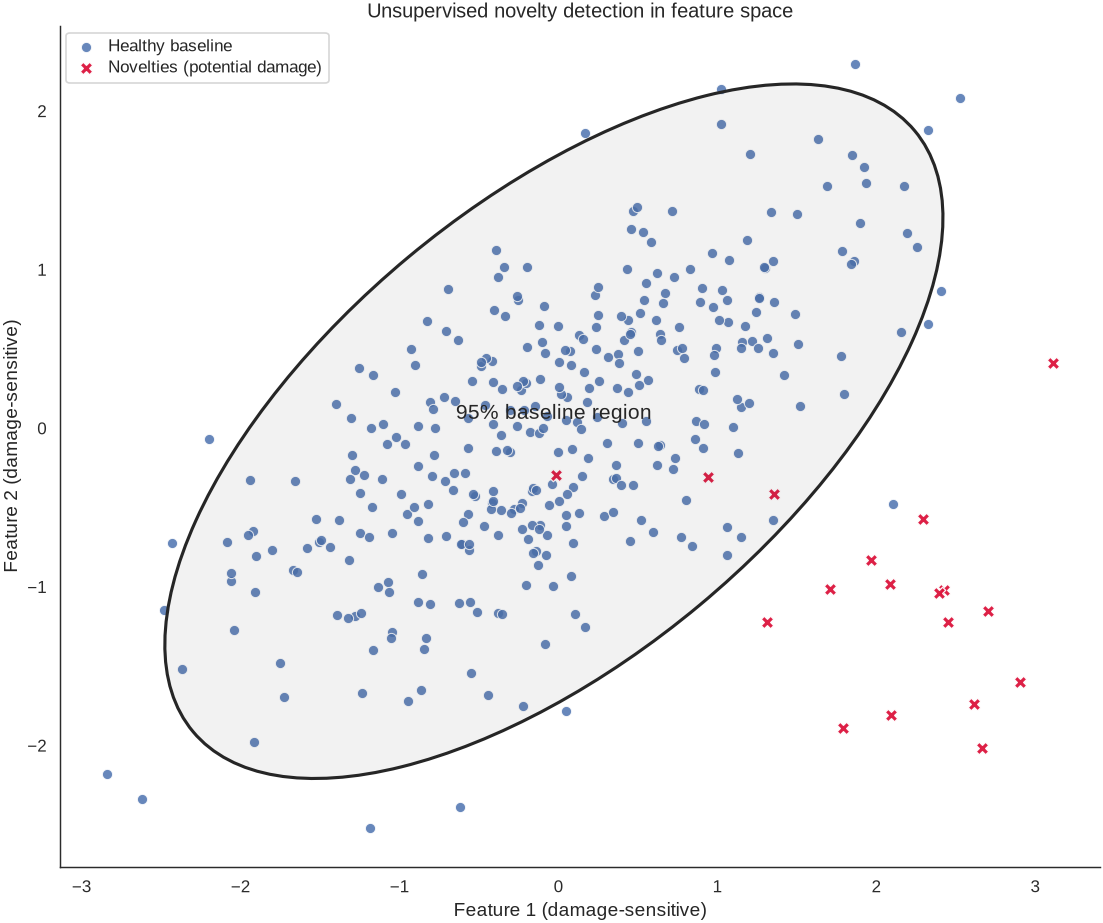
Figure 9:Statistical and ML modeling: healthy baseline cluster with a 95% confidence ellipse (statistical boundary) and novelty points indicating potential damage in feature space.
5Typical Data Streams in Civil Engineering Systems
Understanding the types of data generated by civil engineering structures is essential for designing effective SHM systems. Data preprocessing in bridge SHM supports noise reduction, feature extraction, and standardization of raw monitoring data. Let’s explore the primary categories of data streams that SHM systems typically monitor:
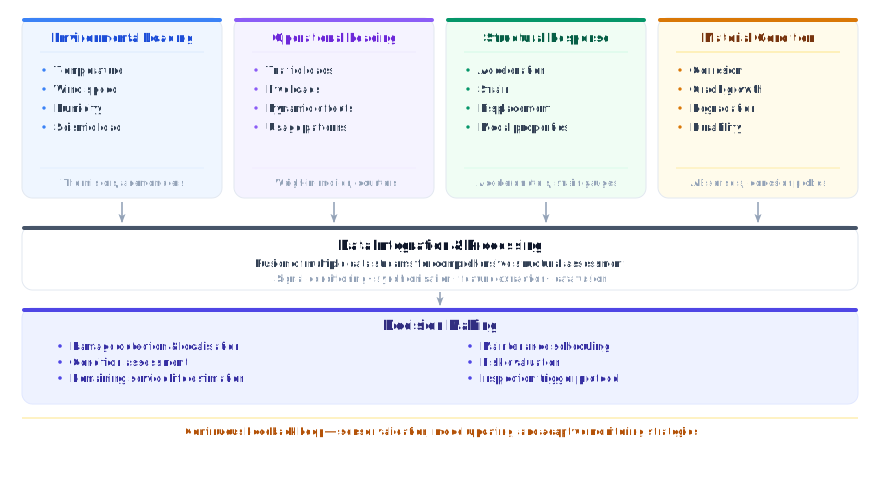
Figure 10:Overview of typical data streams in SHM systems for civil engineering structures.
5.1Environmental Loading Data
Environmental loading data capture the external actions that drive day-to-day and seasonal changes in behavior. Meteorological records (temperature, wind speed and direction, humidity, and precipitation) explain thermal expansion and stiffness shifts, aerodynamic demands on long spans and tall buildings, and moisture-driven degradation in concrete and protective coatings. In seismic regions, ground-motion time histories are characterized by peak and spectral acceleration, frequency content that can excite different modes, and duration or intensity measures that relate to cumulative damage potential.
5.2Operational Loading Data
Operational loading data describe the demands imposed during normal service. For bridges, traffic information from weigh-in-motion systems and counters (vehicle weights, volumes, and speeds) is used to estimate fatigue accumulation, dynamic amplification from moving loads, and lane-by-lane load distribution. For buildings, occupancy data quantify live loads from people, furniture, and equipment, while usage patterns and machinery activity help explain dynamic excitations that may influence comfort, serviceability, or vibration-based indicators.
5.3Structural Response Data
Structural response data record how the asset actually behaves under those demands. Dynamic measurements (primarily acceleration, with velocity derived or directly sensed and displacement obtained by integration or direct sensors) enable identification of modal properties: natural frequencies, mode shapes, and damping ratios. Static and quasi-static measurements (strain, stress inferred from strain and material properties, deflection, and rotation) track load paths, long-term deformations, and reserve capacity. Combining dynamic and static responses improves sensitivity to both global stiffness changes and localized distress.
5.4Material Condition Data
Material condition data provide direct evidence of deterioration mechanisms. In concrete, chloride ingress, carbonation depth, crack width and growth, and moisture content indicate corrosion risk and durability concerns, including freeze–thaw vulnerability. In steel, corrosion rate, fatigue crack initiation and growth (especially at welded details), and coating condition reflect remaining protection and integrity. At connections, bolt and cable tensions and movements at joints and bearings verify that force transfer elements are performing as designed and have not loosened or seized. Integrating these condition indicators with loading and response data reduces false alarms and strengthens conclusions about true structural health.
6From Visual Inspection to Digital Intelligence: The Evolution of Bridge Monitoring
6.1The Traditional Approach and Its Limitations
Historically, bridge inspection has relied heavily on visual assessment by trained engineers. While manual visual inspection with portable devices was the standard approach, this method involves significant manpower and material costs, and cannot achieve the real-time monitoring that modern infrastructure demands. This traditional approach, while valuable, has several inherent limitations. Traditional bridge monitoring relies on periodic inspections, which provide only a handful of data points each year and are often limited in their ability to detect critical events. This approach is largely reactive, responding to issues after they arise, and tends to be costly and highly dependent on weather conditions. In contrast, continuous structural health monitoring (SHM) systems deliver a constant stream of data, capturing all significant events as they occur. This enables predictive maintenance, allowing for early intervention before problems escalate. Continuous SHM is also much more cost-effective on a per-data-point basis and is far less affected by adverse weather, offering a more reliable and complete picture of a bridge’s condition throughout the year. The table below summarizes these differences.
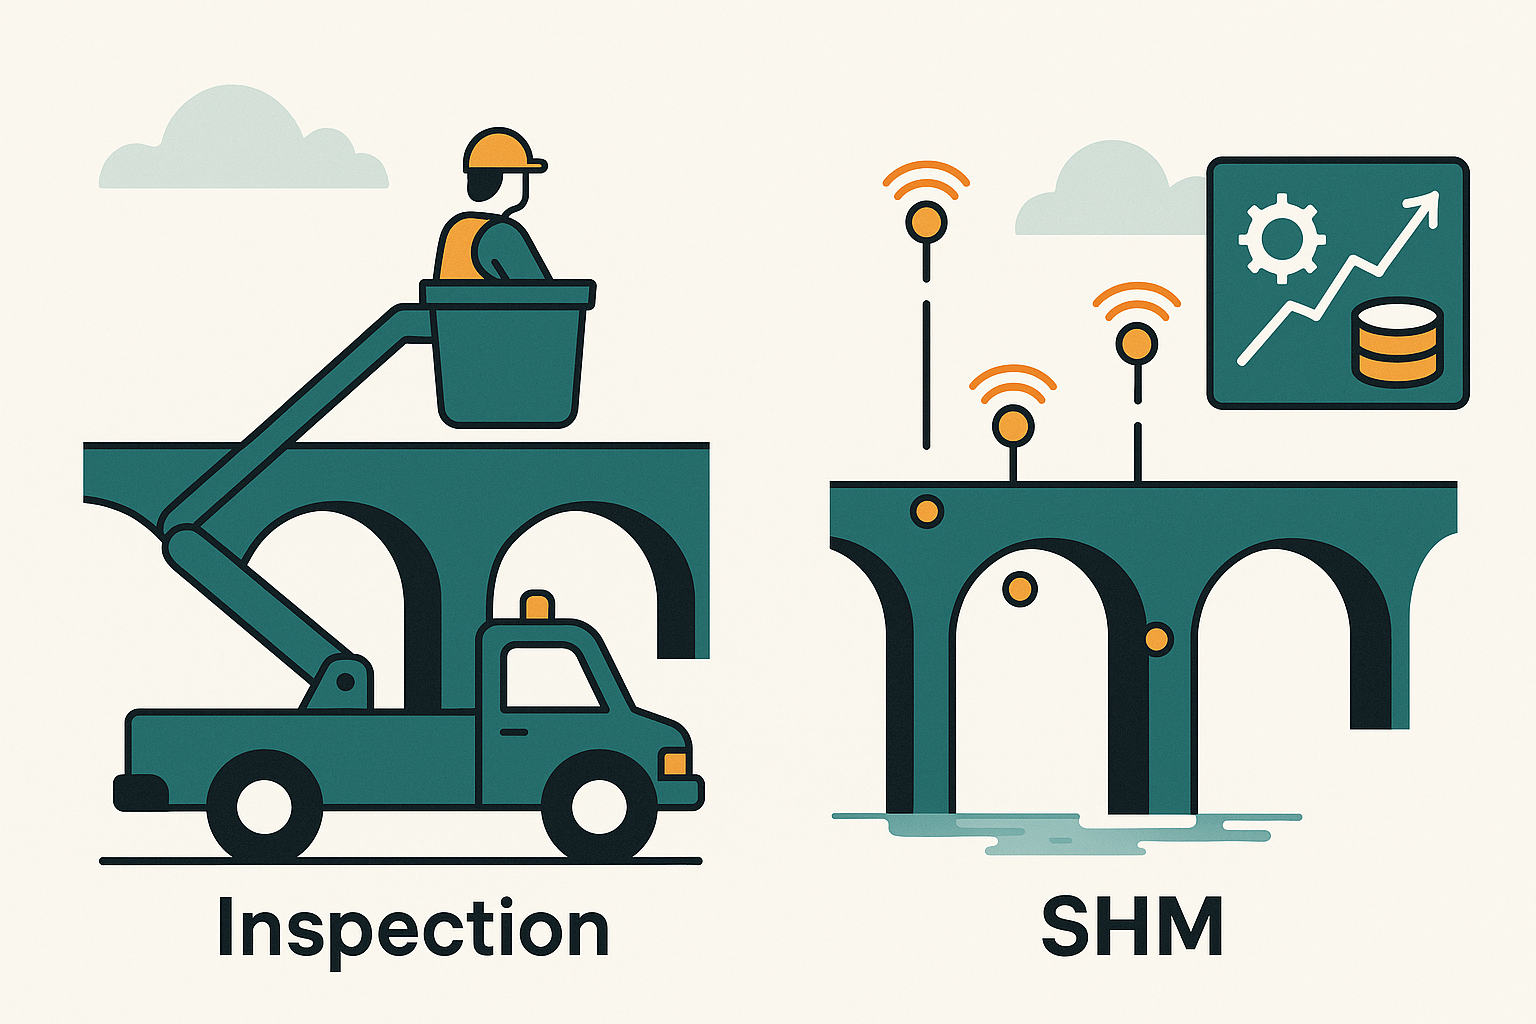
Figure 11:Traditional inspections vs. SHM.
As Table 1 summarizes, traditional inspections provide a necessary baseline for safety but are limited in frequency and detail. SHM complements these by filling the gaps: sensors can collect data 24/7, even in harsh or inaccessible environments, and algorithms can analyze this data to detect anomalies. For example, a visual inspection might note a crack only after it becomes visible, whereas an SHM system could infer a crack forming earlier by detecting a slight change in vibration frequency or strain distribution. Continuous monitoring is also invaluable after extreme events such as earthquakes or hurricanes. Rather than waiting for the next scheduled inspection, engineers can immediately assess a bridge’s condition from sensor data and decide whether it is safe or needs urgent repairs.
Table 1:Comparison between traditional bridge inspection methods and modern structural health monitoring approaches, highlighting the significant advantages of continuous monitoring systems.
| Traditional Visual Inspection | Modern SHM Systems |
|---|---|
| Periodic (months to years) | Continuous (24/7) |
| Subjective interpretation | Quantitative measurements |
| Limited to visible damage | Detects internal structural changes |
| Weather-dependent scheduling | All-weather operation |
| High labor costs | Automated data collection |
| Cannot predict future problems | Enables predictive maintenance |
| Single-point-in-time snapshot | Long-term trend analysis |
6.2The Digital Transformation
The integration of smart sensors, fiber-optic technology, and wireless sensors is reshaping SHM, with IoT-enabled systems providing continuous monitoring and AI-powered data analytics improving anomaly detection [5, 6]. This transformation represents a fundamental shift from reactive maintenance to predictive and prescriptive approaches.
The following conceptual framework illustrates the evolution of bridge monitoring approaches:
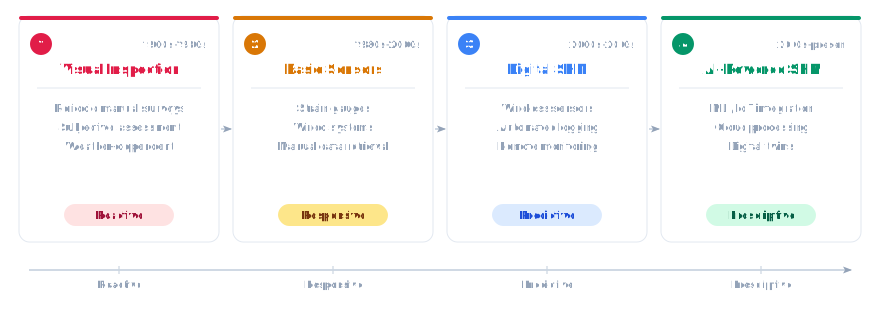
Figure 12:The evolution of bridge monitoring technology shows a clear progression from reactive visual inspections to prescriptive AI-powered systems that can predict and prevent structural problems before they become critical.
7The End-to-End SHM Workflow: From Sensors to Decisions
Implementing SHM on a bridge (or any structure) is a multi-step process. This process involves multiple interconnected stages, each with its own challenges and requirements. It’s helpful to view it as an end-to-end workflow that starts from defining the monitoring goals and ends in actionable decisions. Figure 13 illustrates the typical stages of an SHM system:
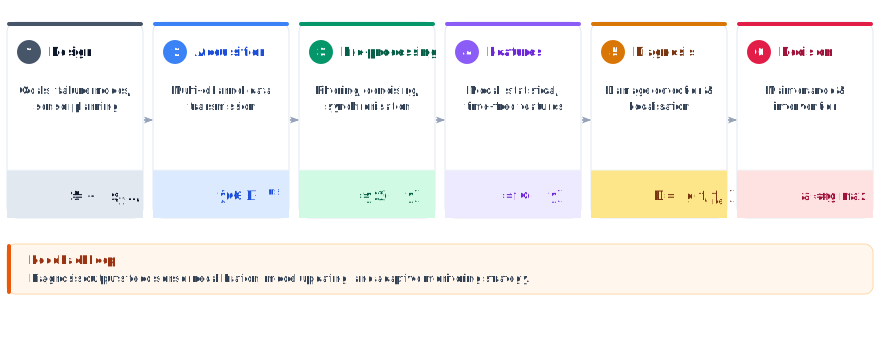
Figure 13:The end-to-end SHM workflow transforms raw sensor data into actionable intelligence for multiple stakeholders, creating a complete system for infrastructure management and public safety.
7.1Stage 1: System Design and Planning
The foundation of any successful SHM system begins with careful planning and design. This stage requires a deep understanding of the structure, its critical failure modes, and the information needed for effective decision-making.
7.1.1Structural Assessment and Failure Mode Analysis
Before installing a single sensor, engineers must thoroughly understand the structure they intend to monitor. This involves:
Structural analysis: Understanding load paths, stress concentrations, and critical elements
Failure mode identification: Determining the most likely ways the structure could fail or degrade
Critical location identification: Pinpointing where damage is most likely to initiate or where it would have the greatest impact
Performance objectives: Defining what the monitoring system needs to achieve
7.1.2Sensor Selection and Placement
The SHM process involves selecting the excitation methods, the sensor types, number and locations, and the data acquisition/storage/transmittal hardware. This critical step involves:
Sensor type selection: Choosing appropriate sensors based on the parameters to be measured
Optimal placement: Positioning sensors to maximize sensitivity to damage while minimizing noise
Redundancy considerations: Ensuring system reliability through strategic redundancy
Installation constraints: Considering practical limitations such as accessibility and power availability
7.2Stage 2: Data Acquisition and Transmission
Once the system is designed and installed, the next challenge is reliably collecting and transmitting data from potentially hundreds or thousands of sensors distributed across large structures.
7.2.1Data Acquisition Systems
Modern SHM systems require sophisticated data acquisition capabilities:
High-speed sampling: Some applications require sampling rates of several thousand Hz
Synchronized measurement: Ensuring all sensors are sampled simultaneously
Signal conditioning: Amplification, filtering, and analog-to-digital conversion
Local data storage: Temporary storage for reliability and redundancy
7.2.2Communication Networks
Recent developments show that wireless sensor networks have become increasingly popular in SHM applications, offering advantages in deployment flexibility and reduced installation costs. Communication strategies include:
Wired networks: Traditional approach offering high reliability and bandwidth
Wireless networks: Increasingly popular due to installation flexibility
Hybrid approaches: Combining wired and wireless technologies strategically
Data compression: Reducing bandwidth requirements through intelligent data processing
7.3Stage 3: Data Processing and Analysis
Raw sensor data requires extensive processing before it can provide meaningful information about structural condition. This stage represents the “intelligence” of the SHM system.
7.3.1Data Preprocessing
Data preprocessing in bridge SHM involves noise reduction, feature extraction, and standardization of raw monitoring data. Essential preprocessing steps include:
Noise reduction: Filtering out environmental and electrical noise
Data cleaning: Identifying and handling outliers, missing data, and sensor malfunctions
Normalization: Accounting for environmental and operational variations
Data fusion: Combining information from multiple sensor types
7.3.2Feature Extraction
The goal is to condense large amounts of data into meaningful features that are sensitive to damage:
Time domain features: Statistical measures, trend analysis, correlation functions
Frequency domain features: Modal parameters, spectral characteristics, transfer functions
Advanced features: Wavelet coefficients, nonlinear dynamics, machine learning features
7.4Stage 4: Analysis and Condition Assessment
This stage involves interpreting processed data to make assessments about structural condition and identify potential problems.
7.4.1Damage Assessment
Damage assessment in bridge SHM involves using preprocessed data to extract features or indicators related to damage and then determining the existence, degree, and location of the damage. The process typically involves four levels [4]:
Level 1: Detection - Is damage present?
Level 2: Localization - Where is the damage?
Level 3: Quantification - How severe is the damage?
Level 4: Prognosis - How will the damage evolve over time?
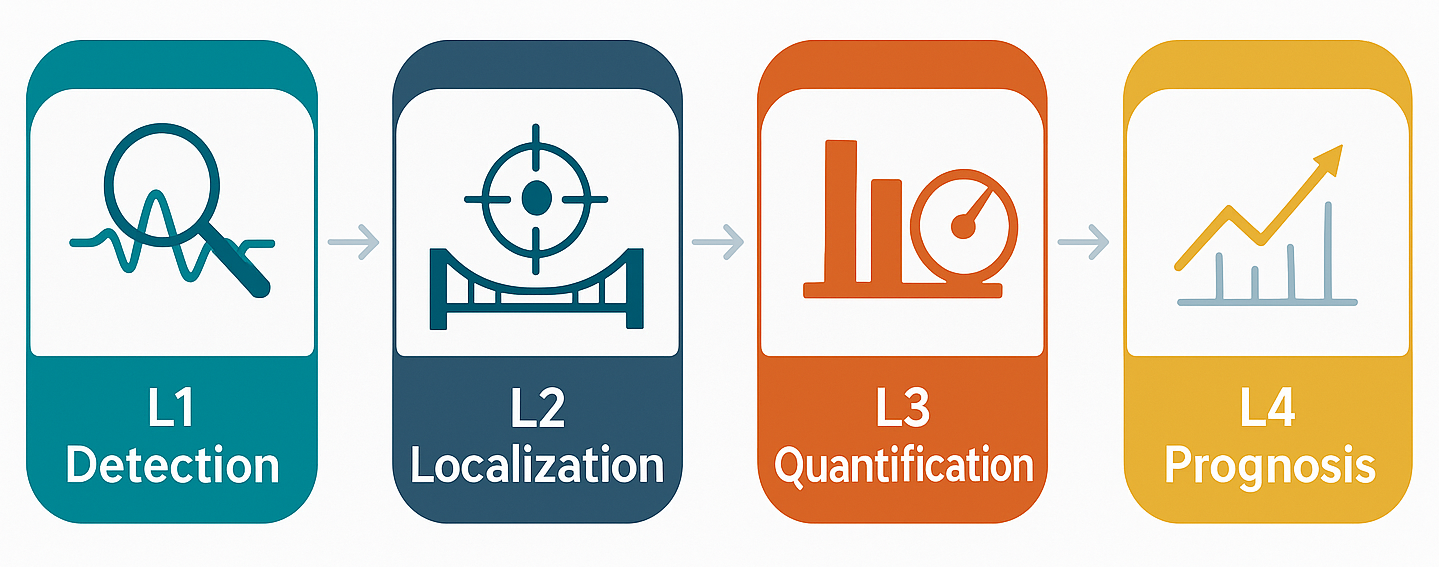
Figure 14:Damage assessment levels in bridge SHM.
7.4.2Pattern Recognition
Modern SHM systems employ sophisticated statistical methods:
Baseline establishment: Defining normal structural behavior
Anomaly detection: Identifying deviations from normal behavior
Classification algorithms: Distinguishing between different types of damage
Uncertainty quantification: Understanding confidence levels in assessments
7.5Stage 5: Decision Making and Actions
The ultimate value of SHM lies in its ability to support engineering decisions and trigger appropriate actions.
7.5.1Risk Assessment
SHM data must be translated into risk-based decisions:
Probability of failure: Estimating likelihood of different failure scenarios
Consequence analysis: Understanding the impact of potential failures
Risk matrices: Combining probability and consequence for decision-making
Acceptable risk levels: Establishing thresholds for different actions
7.5.2Maintenance Planning
SHM enables more effective maintenance strategies:
Condition-based maintenance: Performing maintenance based on actual condition rather than scheduled intervals
Predictive maintenance: Anticipating future maintenance needs
Resource optimization: Allocating maintenance resources more effectively
Life cycle cost analysis: Optimizing long-term economic performance
8Future Directions and Emerging Trends
SHM is moving from periodic, offline analysis to always-on, model-connected, and increasingly autonomous systems. Three trends dominate the horizon: Digital Twins, AI/ML, and Autonomous Systems.
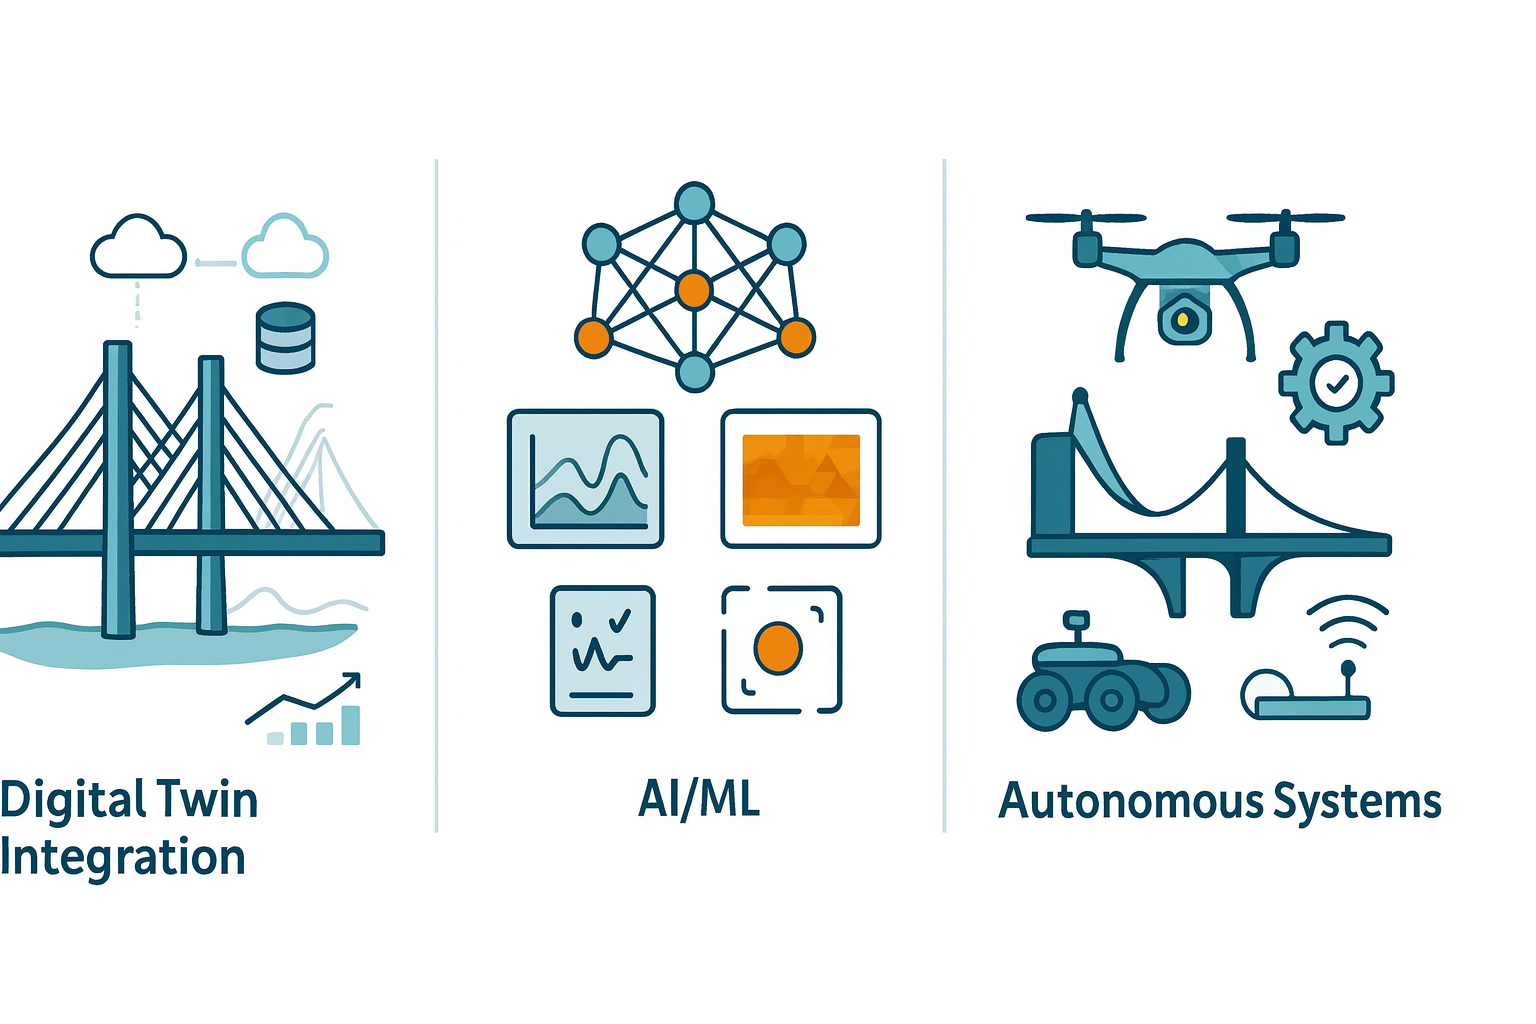
Figure 15:Future Directions in Bridge SHM. From left to right: Digital Twin Integration (cloud-connected models, databases, and data fusion); AI/ML (pattern recognition, forecasting, anomaly detection); Autonomous Systems (drones/rovers, automated inspection, adaptive monitoring).
8.1Digital Twin Integration
Recent work shows that integrating Building Information Modeling (BIM) with SHM systems supports more advanced digital workflows [7]. Future systems will likely feature:
Virtual replicas: Digital twins that mirror physical structures in real-time
Predictive capabilities: Using physics-based models combined with monitoring data
Scenario analysis: Ability to simulate different loading and damage scenarios
8.2Artificial Intelligence and Machine Learning
Machine learning applications in bridge SHM have become increasingly popular for their ability to detect damage on concrete and steel structures [6]. AI integration offers:
Pattern recognition: Automated identification of damage signatures
Predictive maintenance: Forecasting maintenance needs based on data trends
Anomaly detection: Identifying unusual behavior that may indicate problems
8.3Autonomous Systems
Future SHM systems may feature:
Self-calibrating sensors: Sensors that automatically maintain their accuracy
Adaptive monitoring: Systems that adjust their monitoring strategy based on conditions
Autonomous inspection: Integration with drones and robotic inspection systems
9The Road Ahead: Course Structure and Learning Objectives
This introductory chapter has established the foundation for understanding structural health monitoring as both a technical discipline and a critical tool for infrastructure management. As we progress through this course, we will build on these foundational concepts to develop technical skills in sensing, data analytics, and decision-making for civil engineering systems.
9.1Course Learning Progression
The subsequent chapters are carefully structured to build technical expertise progressively:
Chapter 2: Sensor Technologies: We will dive deep into the hardware that makes SHM possible, exploring everything from traditional strain gauges to advanced fiber-optic sensors and emerging IoT technologies. Understanding sensor capabilities and limitations is crucial for designing effective monitoring systems.
Chapter 3: Time-Domain Signal Processing: Raw sensor data requires sophisticated processing before it yields useful information. We will master the fundamental techniques for cleaning, filtering, and extracting meaningful information from time-series data.
Chapter 4: Frequency-Domain Analysis: Many structural behaviors are best understood in the frequency domain. We will explore spectral analysis, modal identification, and advanced transform techniques that reveal hidden patterns in structural response data.
Chapter 5: Feature Engineering & Statistical Anomaly Detection: The key to successful damage detection lies in extracting the right features from monitoring data. We will explore both traditional engineering features and modern machine learning approaches to anomaly detection.
Chapter 6: Optimization & System Identification: This Chapter involves optimizing monitoring systems and identifying structural parameters from monitoring data. We will explore classical optimization.
Chapter 7: Machine Learning Application for Anomaly Detection: Deep learning and unsupervised learning techniques are reshaping how we extract information from monitoring data. We will implement modern ML approaches including one-class SVM and autoencoders.
Chapter 8: Advanced Time-Series Models: Modern SHM systems employ sophisticated mathematical models to understand and predict structural behavior. We will study parametric models, state-space representations, and Kalman filtering for virtual sensing applications.
9.2Practical Skills Development
Throughout this course, you will develop practical skills that are immediately applicable to real-world SHM projects:
Hands-on programming: All major concepts will be implemented in Python using industry-standard libraries
Real data analysis: Working with actual monitoring data from bridge structures
System design experience: Designing complete monitoring systems for specific applications
Critical thinking: Learning to evaluate trade-offs and make engineering judgments
Communication skills: Presenting technical findings to both technical and non-technical audiences
9.3Bridge-Centric Approach
While the techniques we study have broad applicability across civil engineering structures, our examples and case studies will focus primarily on bridge structures. This focus provides several advantages:
Consistency: Using consistent examples throughout makes concepts easier to follow
Depth: We can explore bridge-specific challenges and solutions in detail
Practical relevance: Bridges represent one of the most active areas of SHM implementation
Data availability: Extensive bridge monitoring data is available for analysis
As we embark on this learning journey together, remember that SHM is both a technical discipline requiring rigorous analysis and an applied engineering field that ultimately serves to protect public safety and optimize infrastructure performance. The techniques you will learn represent the current state of practice, but the field continues to evolve rapidly. The strong foundation we build together will serve you throughout your career as new technologies and methodologies emerge.
10Exercises
Solution to Exercise 1 #
a) Accelerometer measurements during wind storm:
Classification: Structural Response (primary), Environmental Loading (secondary)
Reasoning: The accelerometer directly measures the structure’s dynamic response to wind loading. While wind is an environmental load, the accelerometer captures the structure’s reaction to this loading rather than the loading itself.
Interactions: Wind loading (environmental) causes structural vibrations (response) that may be amplified by traffic loading (operational) and modified by temperature effects on material stiffness.
b) Chloride penetration sensors:
Classification: Material Condition
Reasoning: These sensors directly assess the degradation state of concrete materials due to chemical attack.
Interactions: Penetration rates are influenced by temperature and humidity (environmental), traffic-induced cracking that provides pathways (operational effects on structural response), and existing material condition.
c) Strain measurements during rush hour:
Classification: Structural Response (primary), Operational Loading (secondary)
Reasoning: Strain gauges measure structural response, but during rush hour, the primary driver is operational traffic loading.
Interactions: Traffic loads (operational) cause strains (response) that are modified by temperature effects (environmental) and may reveal changes in structural stiffness due to material degradation.
d) Temperature sensors measuring thermal gradients:
Classification: Environmental Loading
Reasoning: Temperature gradients create thermal stresses and are considered environmental loading effects.
Interactions: Thermal effects influence all other categories by changing material properties, causing thermal strains, and affecting degradation rates.
e) Weigh-in-motion sensors:
Classification: Operational Loading
Reasoning: These sensors directly measure the traffic loads applied to the structure.
Interactions: Traffic loads combine with environmental effects (wind, temperature) and cause structural responses that may accelerate material degradation over time.
f) Acoustic emission sensors monitoring crack growth:
Classification: Material Condition (primary), Structural Response (secondary)
Reasoning: While acoustic emissions are a form of structural response, their primary purpose is to assess material degradation through crack propagation monitoring.
Interactions: Crack growth is driven by cyclic loading (operational) and environmental effects, while producing detectable acoustic responses.
Solution to Exercise 2 #
One benefit is real-time condition awareness: bridge owners get continuous feedback on structural performance (for example, detecting that a bridge experienced unusual stresses during last night’s storm), which is impossible with infrequent visual checks. This means quicker emergency response; if something goes wrong, they know immediately. A second benefit is data-driven maintenance optimization: with long-term data trends, owners can move towards predictive maintenance (fixing issues right before they become critical) and avoid unnecessary work. For instance, SHM might show that despite being old, a bridge’s condition indicators are stable, so an expensive retrofit could be safely postponed, saving money. Another possible answer is post-event assessment: after an earthquake or impact, SHM can rapidly indicate whether the bridge is damaged or can remain open, reducing downtime and ensuring safety.
Solution to Exercise 3 #
If an SHM system flags a 30% strain increase on a particular girder under equivalent load, engineers would likely take a series of actions: First, verify the data: check if the sensor is functioning correctly (no calibration drift or damage to the sensor itself). Next, if the data seems reliable, they would conduct a targeted inspection of that girder: looking for visible signs of distress such as cracking, yielding, or connection issues in that area. They might also cross-check with other sensors (e.g., accelerometers or other strain gauges nearby) to see if there are corroborating signs of a stiffness reduction or damage. Additionally, engineers could apply a refined analysis or model update: for instance, update a finite element model of the bridge to see what kind of damage (a crack, section loss, etc.) would explain the increased strain. Based on these investigations, a maintenance decision would be made, possibly load restrictions on the bridge if the issue is serious, or scheduling a repair (like strengthening or replacing the affected component). The key is that SHM guided them where to look, avoiding unnecessary inspection of the entire bridge and focusing on the suspect girder.
Solution to Exercise 4 #
Primary Structural Elements and Failure Mechanisms:
Bridge Deck:
Failure mechanisms: Fatigue cracking, chloride-induced corrosion, freeze-thaw damage, delamination
Environmental factors: De-icing salts, temperature cycles, moisture ingress
Monitoring approach: Embedded corrosion sensors, acoustic emission for crack detection, ground-penetrating radar for delamination
Girders:
Failure mechanisms: Fatigue at details, lateral-torsional buckling, corrosion of steel, concrete deterioration
Environmental factors: Moisture, temperature variations, chemical exposure
Monitoring approach: Strain gauges at critical sections, accelerometers for dynamic response, corrosion monitoring
Bearings:
Failure mechanisms: Wear, deformation, loss of movement capability, anchor bolt failure
Environmental factors: Temperature effects, debris accumulation, seismic loading
Monitoring approach: Displacement transducers, tilt sensors, temperature monitoring
Connections:
Failure mechanisms: Fatigue crack initiation and growth, bolt loosening, weld deterioration
Environmental factors: Stress concentrations, environmental exposure, dynamic loading
Monitoring approach: Acoustic emission, bolt tension monitoring, periodic inspection
Critical Thresholds:
Level 1 (Increased monitoring): Strain exceeding 50% of design values, temperature gradients >20°C
Level 2 (Detailed inspection): Crack detection confirmed, displacement trends exceeding predictions
Level 3 (Load restrictions): Critical strain levels reached, confirmed structural damage
Level 4 (Emergency closure): Imminent failure indicators, safety threshold exceeded
Solution to Exercise 5 #
From a mid-span accelerometer time-series, one could derive: (1) the vibration frequency content of the bridge (via Fourier transform or spectrum analysis): peaks in the frequency spectrum would reveal the bridge’s natural frequencies, which are key indicators of stiffness. (2) the vibration amplitude or RMS under certain loads, for example how much the bridge vibrates when a truck passes, which can be related to the bridge’s damping and condition. Sudden changes in these features (frequency shifts or increased vibration amplitude) over time might indicate structural changes or damage. Additionally, one might use the data to identify events like impacts or earthquakes by looking for characteristic spikes in acceleration.
11References
Farrar, C.R., Worden, K. (2007). “An introduction to structural health monitoring.” Philosophical Transactions of the Royal Society A, 365(1851), 303-315. Farrar & Worden (2006)
Brownjohn, J.M.W. (2007). “Structural health monitoring of civil infrastructure.” Philosophical Transactions of the Royal Society A, 365(1851), 589-622. Brownjohn (2006)
Sohn, H., Farrar, C.R., Hemez, F.M., Shunk, D.D., Stinemates, D.W., Nadler, B.R., Czarnecki, J.J. (2004). “A Review of Structural Health Monitoring Literature: 1996-2001.” Los Alamos National Laboratory Report, LA-13976-MS.
Rytter, A. (1993). Vibrational Based Inspection of Civil Engineering Structures. PhD thesis, Department of Building Technology and Structural Engineering, Aalborg University, Denmark.
Lynch, J.P., Loh, K.J. (2006). “A summary review of wireless sensors and sensor networks for structural health monitoring.” The Shock and Vibration Digest, 38(2), 91-128. Lynch (2006)
Avci, O., Abdeljaber, O., Kiranyaz, S., Hussein, M., Gabbouj, M., Inman, D.J. (2021). “A review of vibration-based damage detection in civil structures: From traditional methods to Machine Learning and Deep Learning applications.” Mechanical Systems and Signal Processing, 147, 107077. Avci et al. (2021)
Sakr, M., Sadhu, A. (2024). “Recent progress and future outlook of digital twins in structural health monitoring of civil infrastructure.” Smart Materials and Structures, 33(3), 033001. Sakr & Sadhu (2024)
This chapter provides the foundation for understanding structural health monitoring in the context of modern civil engineering practice. The concepts introduced here will be developed in greater technical detail throughout the subsequent chapters of this course.
- Farrar, C. R., & Worden, K. (2006). An introduction to structural health monitoring. Philosophical Transactions of the Royal Society A: Mathematical, Physical and Engineering Sciences, 365(1851), 303–315. 10.1098/rsta.2006.1928
- Brownjohn, J. M. W. (2006). Structural health monitoring of civil infrastructure. Philosophical Transactions of the Royal Society A: Mathematical, Physical and Engineering Sciences, 365(1851), 589–622. 10.1098/rsta.2006.1925
- Lynch, J. P. (2006). A Summary Review of Wireless Sensors and Sensor Networks for Structural Health Monitoring. The Shock and Vibration Digest, 38(2), 91–128. 10.1177/0583102406061499
- Avci, O., Abdeljaber, O., Kiranyaz, S., Hussein, M., Gabbouj, M., & Inman, D. J. (2021). A review of vibration-based damage detection in civil structures: From traditional methods to Machine Learning and Deep Learning applications. Mechanical Systems and Signal Processing, 147, 107077. 10.1016/j.ymssp.2020.107077
- Sakr, M., & Sadhu, A. (2024). Recent progress and future outlook of digital twins in structural health monitoring of civil infrastructure. Smart Materials and Structures, 33(3), 033001. 10.1088/1361-665x/ad2bd7